Use Analytics to Identify Your Best and Worst Customers
Harness Customer Profitability Analysis to Boost Profits
David Haertzen
Customer Profitability Analysis (CPA) is an analytic approach that determines the profitability of individual customers or segments of customers by identifying revenue and cost patterns associated with those customers. This includes identifying the most profitable customers (angels) as well as unprofitable customers (devils).
Dr. Robert Kaplan of the Harvard Business School has conducted research that has contributed greatly to CPA. He wrote “.. The most profitable 20% of customers generate between 150 – 300% of total profits. The middle 70% of customers about break even, and the least profitable customers lose 50 – 200% of total profits, leaving the company with its 100% of total profits. Often some of the largest customers turnout to be the most unprofitable.”
Best Buy Case Study
Best Buy was able to build profiles of best and worst customers. Patterns of customer behavior were identified by an analysis of company databases. It’s research showed:
- 20% of customers are angels and result in bulk of profit
- 20% of customers are devils and reduce profits by 20%
- 60% of customers are breakeven
- Profitable and unprofitable customers show patterns of behavior.
Based on the research results Best Buy was able to make changes to improve its profitabilty. The company attracts the most profitable customers by promotions, stocking desired products and providing best service. In addition, the company avoids unprofitable customers by dropping them from promotion lists, stopping loss-leader promotions and charging fees for restocking.
How to Analyze Customer Profitability
Determining the profitability of individual customers is a challenge. Traditional accounting does not identify the profitability of individual customers, so Dr. Kaplan recommends the use of Time Drive Activity Based Costing (TDABC). This approach identifies the true Cost To Serve (CTS) individual customers by adding the service interactions with each customer such as: customer service telephone calls and product returns. This analysis should consider revenues, expenses, opportunites and risks:
| Revenues | Revenues generated may include:
|
| Expenses | Expenses incurred may include:
|
| Opportunites | Opportunities generated may include:
|
| Risks | Risks incurred may include:
|
Detailed, time-phased data that has been integrated at the individual customer level is required.
Time-phasing is needed to determine behavior sequence.
For example, a customer may return an item and then buy back the same item at a lower cost
when it has been restocked.
Profiles of Best and Worst Customers
After determining the profitability of individual customers, customer segmentation analysis can be used to determine behavior patterns of best and worst customers. The segementation may look like this:
| Best Customers | Worst Customers |
|
|
You may find that some of the largest volume customers are the least profitable due to the low prices that they negotiate and the costly service that they require.
References
Analyzing Customers, Best Buy Decides Not All Are Welcome : Wall Street Journal, 2004
Time-Driven Activity Based Costing : Dr. Robert Kaplan – Harvard Business School
Motivation-Need Theories and Consumer Behavior : W. Fred Van Raaij
The Analytical Puzzle – Profitable Data Warehousing, Business Intelligence and Analytics : David Haertzen
Text Mining Use Case
David Haertzen – October 2019
Text mining methods are techniques that can turn unstructured data like emails, tweets and recordings into actionable insights. The knowledge gained can be used to both identify opportunities and serve customers as well as management risks such as cybercrimes. Examples of text mining use cases that capitalize on opportunities include:
- Customer Experience: Obtain knowledge about customers through diverse sources such as emails, surveys and calls to provide automated response and to identify opportunities and issues.
- Contextual Advertising: Target advertising to specific customers based on analysis of text
- Business Intelligence: Answer specific business questions through scan and analysis of thousands of documents.
- Knowledge Management: Gain value from huge amounts of information in areas like product research and clinical patient data.
- Content Enrichment: Add value to content by organizing, summarizing and tagging.
- Social Media Analysis: Scan large data volumes to gather opinions, sentiments and intentions relating to organization reputation, brands and offerings.
Examples of text mining use cases that address risks and losses include:
- Cybercrime Detection: detect malicious threats such as ransomeware and identity theft using machine learning to identify likely malware. Machine learning identifies trends and improved its predictions formed through experience.
- Fraud Detection: Identify potential fraudulent activity such as insurance claim fraud through analysis of unstructured data.
- Risk Management: Scan thousands of documents to find patterns that identifying risks to be addressed.
- Spam Filtering: Reduce the volume of spam through better filtering tuned through machine learning.
How can we take advantage of these use case? One way, is to use the Text Frequency – Inverse Data Frequency (TF-IDF) method to quantity the strength of words that make up documents – based on the relative frequency of words. The flow of this process is illustrated in the following diagram.
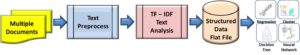
There are five major steps to this process:
- Gather Text: Read in the body of text (corpus) from sources such as: emails, reports, tweets, comments and notes which may be stored as separate files or as fields in a database.
- Preprocess Text: Produce a streamlined version of the text by removing punctuation, shifting to lower case, removing stop words and location words, resolving to word stems (stemming). Using tokenization methods such as “bag of words” render words into streams of numbers.
- Apply TF-IDF Algorithm: Calculate the strength of words using the TD-IDF calculation. Text Frequency (TF) for each word in a document = specific word count divided by total words in document count. Inverse Document Frequency (IDF) = log e(total number of documents / total documents containing the word. Finally, TD-IDF = TF * IDF.
- Output Structured Data File: Generate one flat file record for each input document. Each record will contain a document identifier plus a field for each word of interest. See the example structured flat file below.
- Apply Data Science Algorithms: The generated flat file is in a format where data can be better understood or outcomes predicted using data science algorithms such as: regression, decision tree, clustering or neural network.
![]()
In conclusion, text mining methods are available that can be used to capitalize on opportunites, reduce losses and manage risks. The TF-IDF method is one of many approaches to successful data mining and is a good example of the overall approach. Typically multaple documents are scanned, pre-processed and then analyzed using an algoritm like TF-IDF, Keyword Association Network (KAN) or Support Vector Machines (SVM). Libraries of algorithms such as Python Scikit-learn support text processing via machine learning. I encourage you to learn more about text processing and its applications.
Model Your Customer – Part 1
David Haertzen, September 2019
Would you like to better understand your customers? Customer knowledge can both help to improve revenues, reduce losses and avoid risks. A customer is broadly described as a party (person or organization) who is of interest to the enterprise. A customer model that identifies characteristics of your customers is a great way to achieve a level of understanding and achieve company goals. This article is the first one in a series about customer modeling.
There are two broad categories of customer models: data models and analytical models. Data Models are representations, usually through graphical means, of facts, statistics, or items of information. Data models may be used to: understand data, communicate the structure of data and design data structures. In contrast, Analytical Models are representations of reality coupled with
algorithms that produce results such as: classifications, predictions, optimizations or recommendations.
Customer Data Model
This information can be organized into a high level data model for better understanding and easier management. This diagram shows the Shrewd Data high level Customer Data Model.
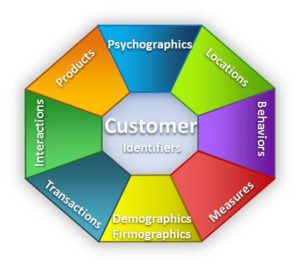
Examples of data for each topic in the customer data model include:
- Customer Identifiers: Account numbers, tax id numbers, drivers license numbers
- Demographics: Birthdate, age, gender, marital status, education level
- Measures: Networth, income, revenue, credit score, Lifetime Customer Value (LCV)
- Behaviors: Social media, driving record, address changes
- Locations: Geo location (country, state, city, zip), district, telephone
- Psychographic: Opinions, values, sentiments, preferences, risk tolerance
- Transactions: Purchases, returns, payments, deposits, withdrawals
- Interactions: Service calls, web visits, abandoned cart, response to offers
- Products: Current products owned, products under consideration
These topics are the “tip of the iceberg”. A full 360 degree view of customer will be comprised of multiple data stores with multiple data sources.
Customer Analytical Models
Analytical models apply algorithms to data to: enable better understanding, make predictions or recommend decisions. Examples of customer analytical models include:
- Acquisition Model: A model that predicts the probability that a prospect will buy the company’s products or services.
- Cross-sell Model: A model that predicts the probability that an existing customer will buy additional products or services of a different type than currently bought. Goods are at the same level.
- Up-sell Model: A model that predicts the probability that an existing customer will buy an upgraded product or service.
- Attrition Model: A model that predicts the probability that an existing customer will stop purchasing the company’s products or services. This also known as a churn model.
- Value Model: A model that predicts a numeric value such as customer lifetime value (CLV) or value resulting from the sale of a specific product to a customer.
- Tone-Of_Voice Model: A model that identifies the most effective message for each targeted customer.
- Risk Model: A model that predicts potential negative activities by customers such as: fraud, loan defaults, or excess service costs.
- Customer Segmentation Model: A model that assigns customers to groups with similar characteristics.
- Recommendation Engine: A model that provides advice on a near real-time basis – such as advice about offers that should be made to a customer or additional products to show to a customer.
- Look-alike Model: A model where the target-marketed group (e.g. for a marketing campaign, product offering etc.) is an expanded list of parties whose profiles look like the selected party.
Customer Model Conclusion
In conclusion, customer models are powerful tools that have the potential to impact an organization’s bottom line. You can learn more about this topic by studying additional articles and white papers provided on the Shrewd Data and other websites.